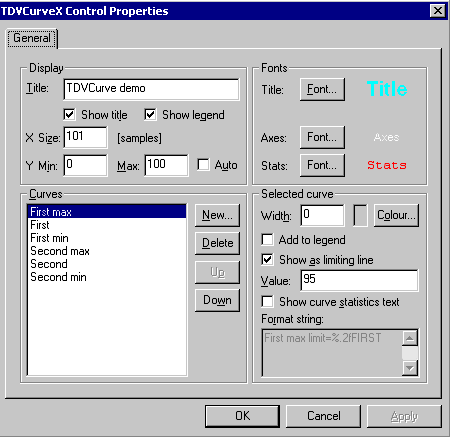
Display
General settings for the display are set here. The display will always have a fixed number of samples in the X direction (horizontal); the Y (vertical) axis can be made either automatic or fixed.
If more than one graph is visible, the “Legend” can be shown to identify the curves.
Fonts
There are three independent font choices – the title, the axes values and the “footer” statistics (key numbers) text. (Note: the “underline” and “strikethrough” selections in the Font selection Dialogue have no effect, although they are present.)
Curves
Up to 100 curves may be displayed simultaneously. Each curve is identified by its unique name (case insensitive). The curves may be ordered (this is reflected in the order of the legend and footer displays).
Selected curve
Each curve can get its own thickness (width) and colour. You can remove the curve name from the Legend box if you want.
If you tick “Show as limiting line”, there will be no curve for this data set, but rather a straight line across the entire graph. The initial value can be specified, and a call to AddData will change the value.
If you tick “Show curve statistics text”, text and key numbers for the curve are formatted and displayed below the curves.
The key number format specification is:
%[format]OP
where format is the standard C library format, e.g. 4.2f og.2g. OP is one of MIN, MAX, AVG, STD, VAR, FIRST or LAST, for minimum, maximum, average, standard deviation, variance, first or last sample, respectively.
Note that the first non-alphabetical character following OP is ignored and will not be printed.
You can have several format specifications in the string, for example:
Min %.2fMIN Max %.2fMAX Average %.2fAVG
(Note the double space characters following the OPs – the first space is ignored.)
|