|
Tool Name:
| Intensity |
|
Tool Index: |
75 |
|
Tool Group: |
Basic |
| |
|
Description:
The Intensity tool processes the intensity value of all pixels in the
defined Region of Interest or search area and calculates statistical data.
A greyscale image consists of Rows x Colums pixels with
8 bit value. The value is in the range from 0 to 255. The values is normally
given the terms intensity. For a color image there are typically three color
planes HSI or Hue, Saturation and Intensity. On the general tab you can
select the color plane to work on. The default plane is the Intensity plane.
The ‘Intensity’ tool generates statistical data and also
generates intensity histogram values. All these output parameters can be used by
other Scorpion tools for further processing.
Intensity thresholds are used in several tools
available in the Scorpion Vision Software, like edge detection tools, blob
detection tools etc. The corresponding tools provide good flexible options
for selecting the most appropriate intensity threshold for getting good
results from the tool processing. However these options work on the region
of interest (ROI) of that specific tool.
‘Intensity’ tool provides additional flexibility in
selecting the most appropriate intensity threshold –
(a) By allowing selection of different ROI, which is referred as the ‘Search
area’ in the ‘Intensity’ tool configuration user interface.
(b) By providing statistical data functions like average, standard deviation
etc.
(c) By providing support for clipping the range of selection based on
minimum intensity and maximum intensity and providing separate statistical
data for the clipped range, also providing support for the percentile values
for the clipped range.
User Interface:
(A) Tool Configuration dialog box – Setup Tab
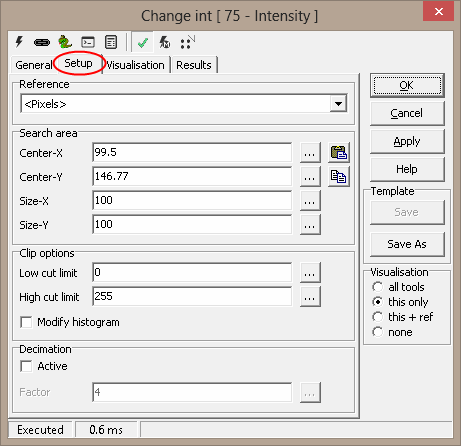
1. The ‘Reference’ drop down can be used to select the
input 2D reference. The input 2D reference provides the origin (0,0) and
rotation of the X and Y-axis. It is strongly recommended to click on the
'Apply' button available on the main tool configuration window, to apply the
newly selected input reference. This reference is then used while
configuring all other tool parameters.
2. The ‘Search area’ group can be used for defining the
region of interest (ROI) for the ‘Intensity’ tool processing. The ‘Search
area’ is expected to be a rectangle.
3. ‘Center-X’ is used to provide the X co-ordinate of the
center of the search area rectangle. The co-ordinates are relative to the input
2D reference.
4. ‘Center-Y’ is used to provide the Y co-ordinate of the
center of the search area rectangle.
5. ‘Size-X’ is used to provide the size of the search area
in the direction of the X-axis as indicated by the input 2D reference.
6. ‘Size-Y’ is used to provide the size of the search area
in the direction of the Y-axis as indicated by the input 2D reference.
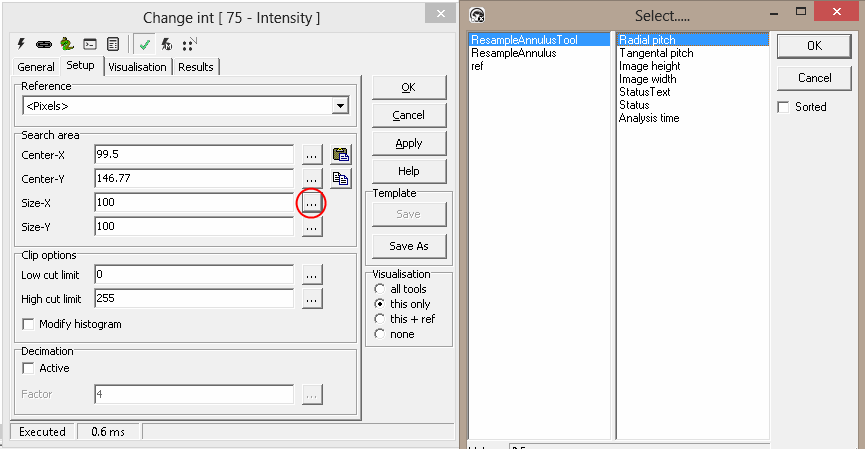
7. It is possible to type in fixed values for the ‘Search area’ properties –
‘Center-X’, ‘Center-Y, ‘Size-X’ and ‘Size-Y’. Also it is possible, to
specify dynamic values for each one of these properties, by assigning them
to any of the properties exposed from other tools defined in the Scorpion
profile. The ‘…’ button available next to each of the ‘Search area’
properties user elements can be clicked to select a tool and its parameter
to be assigned.
8. The ‘Copy’ button under the ‘Search area’ can be used to
copy user defined region from the clipboard to the ‘Search area’ properties.
It is expected that a rectangle is defined on the image, by pressing the
CTRL keyboard key and simultaneously using mouse left button click to define
vertexes of the target rectangle. When ‘Copy’ button is clicked, the search
area parameters are copied from the polygon on the image and are updated in
the ‘Search area’ properties on the configuration dialog box. If use has not
defined a perfect rectangle, or has defined any other polygon, a bounding
rectangle is calculated and is used for updating the ‘Search area’
properties on the configuration dialog box.
If only single point is selected on the image, and ‘Copy’ button is clicked,
only the center of the ‘Search area’ is updated. Which means that the values
for ‘Center-X’ and ‘Center-Y’ are updated whereas the values for ‘Size-X’
and ‘Size-Y’ are unchanged.
If only 2 or 3 points are selected on the image, and the ‘Copy’ button is
clicked, it is ignored and has no effect.
9. The ‘Paste’ button under the ‘Search area’ can be used
to paste the ‘Search area’ properties to the clipboard. This is useful in
viewing the exact location of the search area on the inspection image and
fine-tuning, if required.
10. The ‘Clip options’ group can be used to clip the range
of the pixels used for statistical data generation. The ‘Intensity’ tool
outputs statistical data based on all the pixels from the defined ‘Search
area’, and also outputs separate statistical data for clipped pixels.
11. The ‘Low cut limit’ can be used to specify the lower
limit of clipping. All pixels having intensity values lower then this
threshold; are not included in the clipped pixels, which are used for the
clipped pixels statistical data generation.
12. The ‘High cut limit’ can be used to specify the upper
limit of clipping. All pixels having intensity values higher then this
threshold; are not included in the clipped pixels, which are used for the
clipped pixels statistical data generation.
13. The ‘Modify histogram’ check box can be enabled to
update the output histogram based on the clipped range. If this is
unchecked, the output histogram is generated based on all the pixels in the
‘Search area’
14. The ‘Decimation’ group is used for applying decimation,
which indicates the skipping of pixels, during the ‘Intensity’ tool
processing. Decimation is normally used for reducing the processing time.
The reduction is significant.
15. The ‘Active’ check-box can be enabled to enable the
decimation.
16. The ‘Factor’ can be used to specify the decimation
factor. Lower value indicates lesser decimation and hence larger processing
time. And higher value of factor indicates larger decimation and hence
smaller processing time. The ‘…’ button available next to the ‘Factor’ can
be clicked to select a tool and its parameter to be assigned as the ‘Factor’
value.
Basic Processing when the tool is executed:
1. Intensity values for all the pixels in the specified ‘Search area’ are
access.
2. These intensity values are processed to generate the statistical data
sent out from the ‘Intensity’ tool.
|
Inputs to the Tool: |
| Inputs: |
1. Values of different tool parameters
used in the configuration, at the time of
processing, if dynamic values are used for
any of the configuration parameters |
| Uses Reference: |
Yes, uses a 2D reference |
| Uses Image: |
Yes |
| |
|
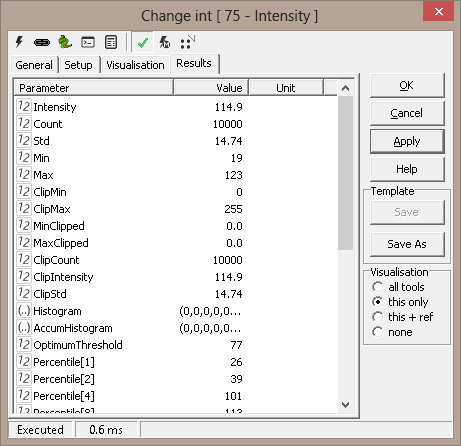
Results
|
Outputs from the Tool: |
| Outputs: |
|
1 |
Intensity: |
Numeric |
Average
intensity of
all the
pixels in
the ‘Search
area’ |
|
2 |
Count: |
Numeric |
Total number
of pixels
available in
the ‘Search
area’.
Please note
that when
'Decimation'
is enabled,
the Count
indicates
the actual
processed
pixels after
decimation. |
|
3 |
Std: |
Numeric |
Standard
deviation
calculated
on the
intensity
values of
all the
pixels in
the ‘Search
area’ |
|
4 |
Min: |
Numeric |
Minimum
intensity
value
observed in
the ‘Search
area’ |
|
5 |
Max: |
Numeric |
Maximum
intensity
value
observed in
the ‘Search
area’ |
|
6 |
ClipMin: |
Numeric |
Minimum
intensity
value
observed in
the clipped
pixel range |
|
7 |
ClipMax: |
Numeric |
Maximum
intensity
value
observed in
the clipped
pixel range |
|
8 |
MinClipped: |
Numeric |
Percentage
of pixels
which are
excluded
from the
clipped
pixels, due
to the ‘Low
cut limit’
validation.
Percentage
is
calculated
with respect
to the
'Count' |
|
9 |
MaxClipped: |
Numeric |
Percentage
of pixels
which are
excluded
from the
clipped
pixels, due
to the ‘High
cut limit’
validation.
Percentage
is
calculated
with respect
to the
'Count' |
|
10 |
ClipCount: |
Numeric |
Number of
pixels in
the clipped
range.
Please note
that when
'Decimation'
is enabled,
the
ClipCount
indicates
the actual
processed
pixels in
the clipped
range, after
decimation. |
|
11 |
ClipIntensity: |
Numeric |
Average
intensity of
all the
pixels in
the clipped
range |
|
12 |
ClipStd: |
Numeric |
Standard
deviation
calculated
on the
intensity
values of
all the
pixels in
the clipped
range |
|
13 |
Histogram: |
Array |
Array
representing
the
histogram
generated
based on the
intensity
values of
the pixels.
If ‘Modify
histogram’
option is
selected,
histogram is
generated
based on the
clipped
range;
otherwise
the
histogram is
generated
based on all
the pixels
in the
search area.
The output
histogram is
an array of
size 256,
and each
element
represents
the
frequency of
occurrence
of the
associated
intensity
value (0 to
255) in the
target
pixels. |
|
14 |
AccumHistogram: |
Array |
Array
representing
the
accumulated
histogram
generated
based on the
intensity
values of
the pixels.
If ‘Modify
histogram’
option is
selected,
histogram is
generated
based on the
clipped
range;
otherwise
the
histogram is
generated
based on all
the pixels
in the
search area.
The output
histogram is
an array of
size 256,
and each
element
represents
the
accumulated
frequency of
occurrence
of the
associated
intensity
value (0 to
255) in the
target
pixels.
Accumulated
frequency
indicates
the
occurrence
of the
associated
value and
all
occurrences
of intensity
values
lesser than
it. |
|
15 |
OptimumThreshold: |
Numeric |
Optimum
threshold
calculated
using
advanced
algorithms.
This can be
used as a
dynamic
intensity
threshold by
other
Scorpion
tools like
edge
detection
tools and
blob
detection
tools for
getting best
results |
|
16 |
Percentile[<n>]: |
Numeric |
Percentile
calculated
based on the
intensity
values of
all the
pixels in
the search
area.
Following
percentiles
are
available -
1, 2, 4, 8,
10, 20, 30,
40, 50, 60,
70, 80, 90,
92, 96, 98,
99. E.g.
Percentile[1]
indicates
Percentile 1
value. |
|
17 |
StatusText: |
Text |
This is a
standard
output from
all Scorpion
tools and
describes
the
processing
status |
|
18 |
Status: |
Numeric |
This is a
standard
output from
all Scorpion
tools and
indicates
error/success
of the tool
processing.
1 indicates
success and
0 indicates
error. |
|
19 |
AnalyzeTime: |
Numeric |
This is a
standard
output from
all Scorpion
tools and
indicates
the time
taken by the
last
processing
operation of
this tool |
|
| Visualizations: |
|
1 |
ROI: |
Displays
the search
area
rectangle |
|
| Reference outputs: |
None |
| |
|
|
Templates: |
| Supports Templates: |
No |
| |
|
|
ExecuteCmd Support:
More
information |
| |
Command |
Arguments |
Return value |
Description |
| 1 |
“Set” |
“Object=ROI;Value=<polygon>”
where <polygon> is the array of polygon
vertex points indicating region of interest
(ROI) |
Tuple,
where
first element indicates success(1) or
failure (0) |
Sets the search area |
| 2 |
"Set" |
“Object=ROI;Value=<cx>,<cy>,<dx>,<dy>”
where <cx> is the X co-ordinate of the
center of the rectangle,
<cy> is the Y co-ordinate of the center of
the rectangle,
<dx> is the size of the rectangle in X
direction,
<dy> is the size of the rectangle in Y
direction |
Tuple,
where
first element indicates success(1) or
failure (0) |
Sets the search area |
| 3 |
"Get" |
“Object=ROI” |
Tuple,
where
first element indicates success(1) or
failure (0),
second element is an array indicating the
search area rectangle polygon |
Gets the search area |
Please refer to the Copy/paste
ROIs for more information on 'Copy Paste ROI using
executeCommand'.
|
