|
The Pareto2 plug-in is used for monitoring distribution of some values.
For example, this could be a classification of products to different
categories.
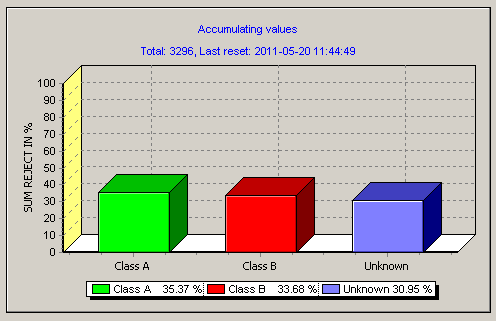
In the picture below main plug-in screen with Pareto
graph is shown.
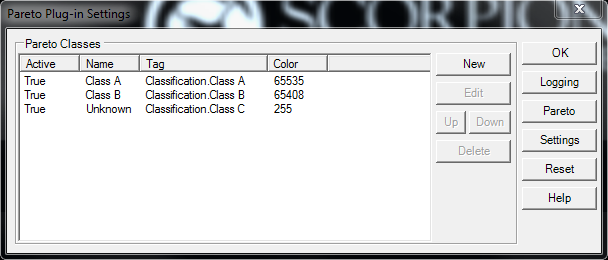
Settings dialog is used for configuration of the plug-in (see the
picture below). It is invoked by clicking right mouse button on the Pareto chart
and selecting Settings from popup menu (Scorpion must be in
service mode).
In Settings dialog it is possible to add the categories ("Pareto
Classes") for showing them in the graph. The user could add, edit or
delete Pareto classes. Each class has its own bar color and attached
to the Scorpion tag for getting value to show. Also it is possible to accesses plug-in settings and Pareto graph
properties.
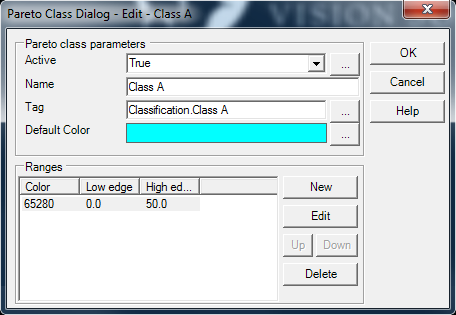
Dialog shown in the picture below is
used for Pareto class creating or editing. In this dialog the following
settings could be changed:
- Active - Is this class active (shown in Pareto). This
item could be linked to Scorpion Boolean tag;
- Name - Pareto class name to be displayed in the graph (the
name should be unique);
- Tag - tag name for getting values from;
- Default Color - bar color in the Pareto graph;
- Ranges - is used for setting different bar colors when
values are in specific ranges. If value does not fit in Ranges the Default Color is
used.
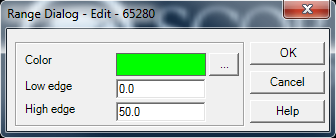
In the range dialog (see picture below) it
is possible to associate color with value range between Low edge
and High edge.
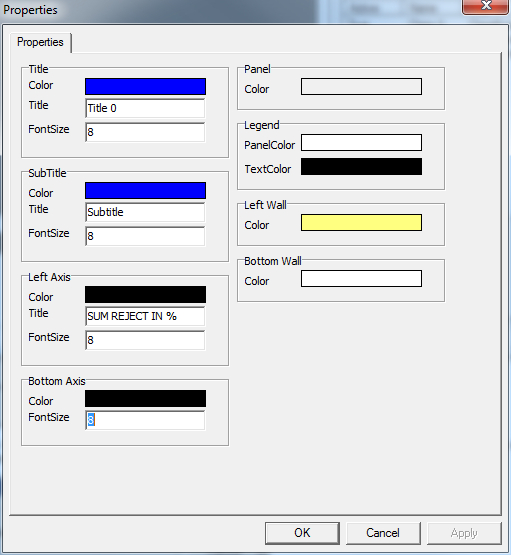
In Pareto graph properties dialog it's possible to specify properties of the Pareto graph. Use title and subtitle properties only if you need static text and if
you are not going to specify title or subtitle in Pareto plug-in settings (see below).
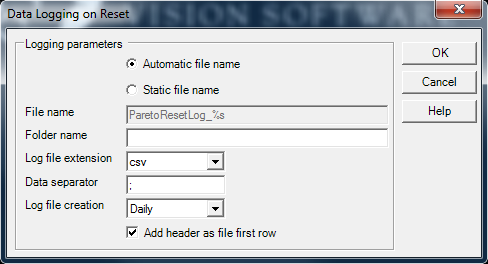
In Data Logging on Reset dialog it
is possible to setup log file name for dynamic creation. For example new log file
for each day could be started if you select Automatic file name. In case
of Static file name everything will be logged in the same file. Data separator
is used for value separation in log file. If Add header as file first row check box is selected
- classes
names of the Pareto will be logged to the log file first row.
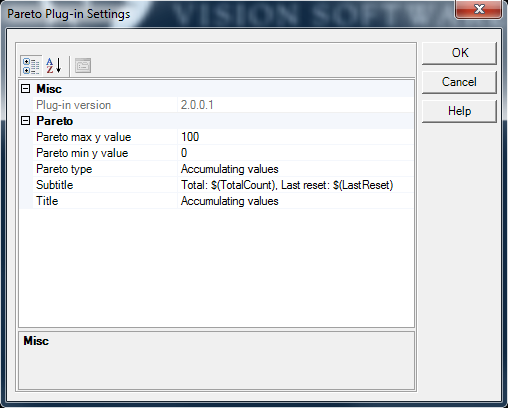
In Pareto plug-in settings dialog (picture below) these settings
could be set:
- Pareto max y value - maximum value to show on Pareto
graph y axis.
- Pareto min y value - minimum value to show on Pareto
graph y axis.
-
Pareto type -
Pareto appearance mode. Possible values:
- Accumulating values - if this type is set,
Pareto graph will be collecting values from tags and
summarizing them;
- Static values - if this Pareto type is used,
there will be no tag value accumulation performed, and
Pareto graph will show current tag values distribution.
- Subtitle* - Subtitle for Pareto chart.
- Title* - Title for Pareto chart.
* - It is possible to use tags in Pareto title and subtitle. The tag notation is $(tagname). It will be replaced with actual value.
Pareto also contains built in tags:
- TotalCount - Total count of inspected items;
- LastReset - Last time of Pareto reset.
|