|
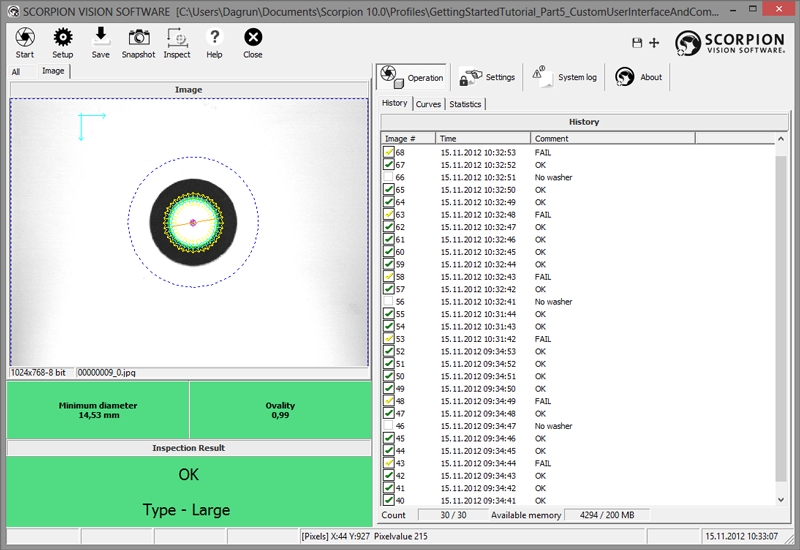
The screen picture under normal
operation is shown below. The picture can roughly be divided into the
following parts:
Main buttons
(upper row, below the main window title). These buttons are used to Start,
Stop and Close the system. Additionally there are two
buttons to lock/unlock the password protected Settings and Service
panels. You can save an image by pressing Image and do a manual
inspection by pressing Inspection. Save the profile by pressing Profile.
If two or more systems are simultaneously running on the same machine, the Next
button is used to toggle between the systems.
In settings and service mode you will also see: The Snapshot
and Inspection buttons that are used to take an image and inspect
this for instance at system verification, configuration or on manual
operation.
Image
(left,
below the main buttons). The camera images of the unit to be identified are
shown here. Selecting and dragging the image can zoom in details. A simple
click zooms back. You can choose to see one or all images at a time in
systems using more than one image for classification. See Image
operations for a description of available camera image
features.
Inspection Results
(lower left) shows the running inspection results. The classification result
is shown in text – we call it the state. Additionally you can display one
or more result parameters in this field. (In the above example given by the
‘Distance’ parameter.) Right click the mouse over the field, and you see
the menu to choose from. You need however to be authorized to change the
result panel set-up. Normal conditions are usually indicated by a green
background colour, other conditions by for instance yellow or red. You set
the colour under Service-States.
Indicator panel
The Indicator panel
is showing selected measured values calculated by Scorpion’s logical
tools. The inspection result is based on these values. On error, the
representing indicator panel field changes colour to e.g. red to illustrate
the cause of the error. If you are authorized, you can change the value to
be shown as well as the title and colour of the indicator panel fields.
Press the right mouse button over the field and select from the menu showing
up. You can also extend the panel by adding more fields or remove fields
from the panel.
Detailed panels
(right), here you can chose different detailed information: history, curves,
results or statistics. Here you also find the Settings and Service
panels.
Status bar
(bottom line) shows different indicators of the system status. From left to
right:
-
Image
trigger - status for ready signal from the production line
-
Status
for manual code signal from the production line
-
Status for reset
signal from the production line
-
Status for quality
alarm
-
Row/column
coordinates, pixel value and name of graphical image components. The
values change when moving the mouse within an image.
-
Date and time
Service
Toolbar
In Service mode
the service toolbar is available.
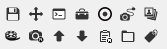
- Save current image to disk
- Full image mode
- Show/Hide console window
- Goto Toolbox
- Goto Central
- Camera simulation On/Off
- Open simulation folder
- Activate/Deactivate live video
- Reset camera list
- Next image in history list
- Previous image in history list
- Reset Clipboard
- Explore the Profiles folder
- Open the Parameter browser
Moving the cursor on top of the toolbar will show the hint.
|
