|
You can choose between numbers of
curves illustrating different values calculated by the system. All measured
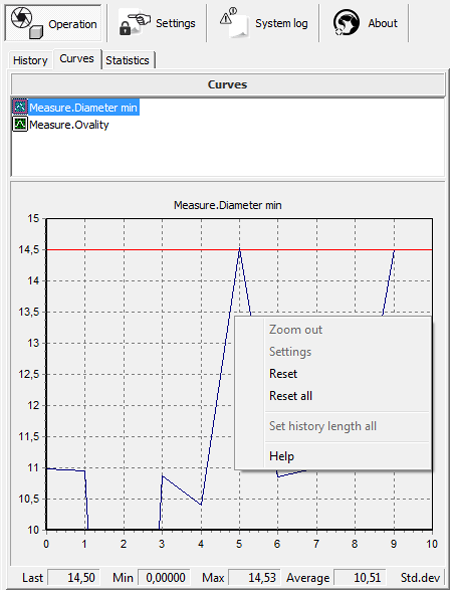
values can be graphed. Right click the mouse to see a menu and select add
or remove curve.
(Note: you can only add or
remove a curve in Settings or Service mode. Select Settings in the
main panel and give the password.)
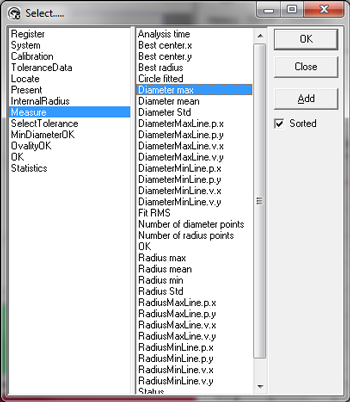
If you are adding a curve, you get
a list of all values available. The left column shows the image tools used
in the analyses. The right column shows the values measured by the tool.
Choose a value, click Ok and the value is graphed.


Right click the mouse over the
curve, and you can reset this or all curves, open the settings panel (if you
are authorized) or set the history length similar for all curves.
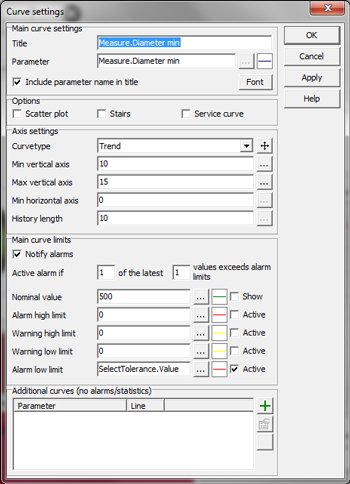
Adjustments of alarm limits and
curve values can be done if you are in settings mode (click on Settings
in the main menu and give the correct PIN code). Double click the curve name
to see the adjustment parameters. You can adjust the curve axes and the
alarm limits (alarm limits are here shown in red). The image below gives you
an example.

The curves show if measured values
are within given limits. This is useful e.g. to check the light conditions.
Select the Notify alarm field if alarms are to be notified. Alarm
limits are normally defined based on operator experience. There are two
independent types of limits: operational and alarm limits. An event in the
system log and a quality alarm are the results of an exceeded operational
limit. If an alarm limit is exceeded you can make the system stop if the
option for this is chosen (see Service-General).
Supervise only the parameters
that operator experience finds useful and give them realistic limits. You
may loose overview, control and trust in the system if the number of
supervised parameters and generated alarms are too large.
|