2D visualizing in 2D images:
- ok = DrawMarker(refName, x, y, color=yellow, markerSize=3, vertexStyle=1)
- ok = DrawMarkers(refName, pnts, color=yellow, markerSize=3, vertexStyle=1) #pnts=tuple/list of points
- ok = DrawLine(refName, x, y, u, v, color=yellow, penWidth=1, vertexStyle=0) #u=length, v=angle units
- ok = DrawLineEx(refName, x1, y1, x2, y2, color=yellow, penWidth=1,penStyle=0) #(x2,y2) - end point
- ok = DrawRect(refName, x, y, w, h, color=yellow, penWidth=1, penStyle=0)
#(x,y) = upper left
- ok = DrawRectEx(refName, x, y, w, h, angle=0, color=yellow, penWidth=1, penStyle=0)
#(x,y) = center
- ok = DrawCircle(refName, x, y, r, color=yellow, penWidth=1, penStyle=0)
- ok = DrawText(
- refName, x, y, text, color=yellow, fontSize=8, fontName=Tahoma,
- backColor='', fontStyle=0,
- align=0, scale=0, angle=0)
- ok = DrawPolygon(
- refName, pnts, color=yellow, penWidth=1, penStyle=0, closed=True,
- markerSize=0, vertexStyle=1, markerColor=color)
- ok = DrawBitmap(refname,x,y,filename,hAlign=1,vAlign=1,style=0,dx=-1,dy=-1)
2D transform functions:
- PixToObj - transform from pixel coordinates to
reference coordinates
- (x,y) = PixToObj( refName, x, y )
- (x,y) = PixToObj( refName, p )
- ((x,y),(x,y)..(x,y)) = PixToRef( refName, pnts )
- ObjToPix - transform from reference coordinates
to pixel coordinates, both 2D and 3D
- (x,y) = ObjToPix( refName, x, y )
- ((x,y),) = ObjToPix( refName, ((x,y),) )
- (x,y) = ObjToPix( refName, ((x,y,z),))
3D transform functions:
- Transform3DTo2D(fromRef3D, plg, toRef2D)
- converts 3D point/polygon from 3D to 2D
- Transform2DTo3D(fromRef2D, plg, toRef3D, z=0)
- converts 2D point/polygon from 2D to 3D
3D visualizing in 2D images:
- ok = DrawMarker3D(refName, x, y, z, color, markerSize, vertexStyle)
- ok = DrawLineEx3D(refName, x1, y1, z1, x2, y2, z2, color='yellow', penWidth=1, penStyle=0)
#x2,y2 - end point
- ok = DrawRectEx3D(refName, x, y, z, w, h, angle=0, color='yellow', penWidth=1, penStyle=0)
#(x,y) = center
- ok = DrawCircle3D(refName, x, y, z, r, color='yellow', penWidth=1, penStyle=0)
- ok = DrawText3D(refName, x, y, z, text, color='yellow', fontSize=8, fontName=Tahoma,
backColor='', fontStyle=0, align=0, scale=0, angle=0)
- ok = DrawPolygon3D(refName, pnts, color='yellow', penWidth=1, penStyle=0, closed=True,
markerSize=0, vertexStyle=1, markerColor=color)
- ok = DrawCube3D(refName, x, y, z, w, h, d, angle=0,
color='yellow', penWidth=1, penStyle=0)
#(x,y,z) = center
- ok = DrawCylinder3D(ref,x,y,z,r,h,sector=0,width=360,col='yellow',width=1,style=0) #(x,y,z)
= center
Polygon 2D and 3D transformations:
- TranslatePolygon(plg,offs)
- 2D: plg=2D, offs=(x,y)
- 3D: plg=3D, offs=(x,y,z)
- RotatePolygon(plg,center,rotation,order=0)
- 2D: plg=2D, center=(x,y),rotation=degrees
- 3D: plg=3D, center=(x,y,z),rotation=(rx,ry,rz),
- ScalePolygon(plg,center,scale)
- 2D: plg=2D, center=(x,y), scale=(sx,sy)
- 3D: plg=3D, center=(x,y,z),
scale=(sx,sy,sz)
- PolygonCOG(plg) # calcultaes COG - Center of Gravity for
polygon
Polygon creation:
- PolygonRect(center,size,angle=0) # creates 2D and 3D
rectangles
- 2D: center=(x,y), size=(dx,dy),
angle=float
- 2D: center=(x,y,z), size=(dx,dy),
angle=float
- PolygonCircle(center,radius,step=5,sector=0,width=360) #
creates 2D and 3D circles
- 2D: center=(x,y),radius=float,
step,sector,width=degrees
- 3D: center=(x,y,z),radius=float,
step,sector,width=degrees
Polygon 2D and 3D operations:
- PolygonLength(plg,closed=0)
- return length of 2D/3D polygon in
polygon coordinates
- PolygonClose(plg)
- closes an open 2D/3D polygon, ie,
appends point plg[0] at end
- ResampledPolygon(plg,step,closed=0,mode=0)
- mode=0, resample 2D/3D polygon in step
length
- step is in plg
coordinate system
- mode=1, resample 2D/3D polygon in N
equal elements
- the polygon is divided
in N steps where step = N
- PolygonPoint(plg,t,closed=0)
- return point on 2D/3D polygon given by
t[0..1],
- where t=0 is start and t=1 is end
of polygon
- PolygonIntersect(plg,pnt,angle,closed=0) # 2D only
- return the intersection from pnt at
given angle and polygon
- With a complex polygon multiple
intersections exist - the first is returned
When drawing from a PythonScript tool, either from the tool directly, or
by calling Central scripts from the PythonScript tool, all drawing will be
in the image given by the PythonScript's ImageIndex.
When drawing in Central
scripts and the caller is not a PythonScript tool, the image to draw in must
be given by the DrawAt function.
- ok = DrawAt(imagename)
- ClearOverlay() - clear python draw items in current "DrawAt" image
The parameters in italics are optional.
- refName -
- text
- referencename
- refName="" means pixelcoordinates or coordinates of
tool instance
- x,y -
- pnts -
- array of points as python tuple, ((x1,y1),(x2,y2),(x3,y3),...(xn,yn))
- color -
- text
- 'Red',
'Yellow', 'Blue', 'White', 'BtnFace' etc....
- '$Hex' - '$FFFF00'=Cyan, '$FF0000'=Blue etc...
- '0xHex' - '0xFFFF00'=Cyan, '0xFF0000'=Blue etc...
- Default is 'Yellow'
- vertexStyle -
- integer
- ovsNone=0, ovsDot=1, ovsPlus=2, ovsX=3, ovsStar=4,
- ovsCir=5, ovsCrosshairs=6, ovsLine=7, ovsDotLine=8,
- ovsPlusLine=9, ovsXLine=10, ovsStarLine=11, ovsCirLine=12,
- ovsCrosshairsLine=13, ovsArrow=14, ovsDotArrow=15,
- ovsPlusArrow=16, ovsXArrow=17, ovsStarArrow=18,
- ovsCirArrow=19, ovsCrosshairsArrow=20, ovsFatX=21,
- ovsTriangle=22, ovsStop=23, ovsSquare=24
- markerSize
-
- integer - pixelsize on marker
-
default=3
- penWidth -
- integer - penwidth
- default = 1
- penStyle -
- integer
- psSolid=0, psDash =1, psDot=2, psDashDot=3, psDashDotDot=4,
psClear=5, psFilled=6
- fontsize -
- font size in points
- default = -1
- fontName -
- backColor -
- the text back color, coded the same way as color
- default = '' - transparent background
- fontStyle
- binary coded integer
- bit 1=bold, bit 2=italic, bit 3=underline, bit 4=strikethrough
- default=0 (normal text)
- hAlign/align
- 0 = leftjustified
- 1 = rightjustified
- 2 = center
- vAlign
- 0 = verticalTop
- 1 = verticalBottom
- 2 = verticalCenter
- scale - DrawText
- text scaling factor used for hiding text unless
zoomed. The scale is minimum size of an image pixel in
screen pixels before the text gets visible.
- angle - DrawText
- style - DrawBitmap
- 0 - x,y is relative to alignment corner in view
coordinates - fixed bitmap size
- 1 - x,y is relative to aligned corned in bitmap
coordinates - fixed bitmap size
- 2 - x,y is relative to aligned corner in bitmap
coordinates but size is scaled due to zoom
- dx,dy - DrawBitmap
- bitmap size in pixels, defaults to -1, using bitmap
size
Example 1: DrawLineEx
- DrawLineEx('Reference',10,10,20,20,'Red',2,0)
Example 2: Drawmarker
- DrawMarker('',12,12,'Blue',12,18)
Example 3: DrawRect
- DrawRect('Reference',12,12,200,100,'Yellow',3,1)
Example 4: DrawPolygon
- DrawPolygon('Reference',((0,0),(10,13),(13,17),(20,11)),'red')
Example 5: DrawText - default font tahoma
- DrawText('Reference',10,10,'Some Text')
Example 6: DrawText - fontsize 12 - bold with default font yellow on
red background
- DrawText('Reference',10,10,'Some Text','yellow',12,'','red',1)
Example 7: DrawText - scale - visible only when zooming
ref='ref1'
x=-40
y=2
DrawRect(ref,x,y,1,1)
DrawText(ref,x-9,y+4,'Zoom in to show details of scale 2,4 and
8...','red',12)
DrawText(ref,x-2,y+4,'Zoom scale 2','red',12,'Tahoma','',0,0,2) #last param
is scale
DrawText(ref,x+3,y+4,'Zoom scale 4','red',10,'Tahoma','',0,0,4) #last param
is scale
DrawText(ref,x+7,y+4,'Zoom scale 8','red',8,'Tahoma','',0,0,8) #last param
is scale
Example 8: DrawBitmap - on top of image
import os
path=os.path.join(GetStringValue('System.Profile'),'Icons')
print path
#DrawBitmap parameters
#(ref,x,y,bitmapName,Left=0|Right=1|Center=2,Top=0|Bottom=1|Center=2,Fixed=0|FixedImage=1|Scale=2,dx,dy)
DrawBitmap('',6,6,os.path.join(path,'is-2012-0045 SVA-00008 Color
Identification Version X Image.png'),1,1,0,230,157)
DrawBitmap('',6,6,os.path.join(path,'is-2012-0045 SVA-00008 Color
Identification Version X Image.png'),0,1,1,115,74)
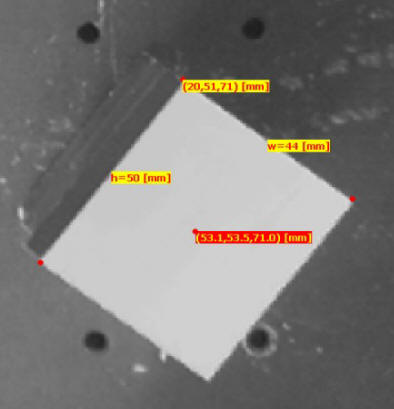
Example 9: 3D Measurement Visualisation
def GetPoint3D(name):
  x = GetFloatValue(name+'_x')
  y = GetFloatValue(name+'_y')
  z = GetFloatValue(name+'_z')
  return x,y,z

def CenterPoint3D(x1,y1,z1,x2,y2,z2):

    x = x1 + (x2-x1)/2.0
    y = y1 + (y2-y1)/2.0
    z = z1 + (z2-z1)/2.0
    return x,y,z

x,y,z = GetPoint3D('Height.center')
print 'pos -',x,y,z

str0 = '(%(x).1f,%(y).1f,%(z).1f) [mm]' %vars()
DrawMarker3D('1-3DRef',x,y,z,'Red')
DrawText3D('1-3DRef',x,y,z,str0,'yellow',10,'','red',1)


status = GetValue('Height.status')

if status == 1 :

  x,y,z = GetPoint3D('Height.corner')
  print 'pos -',x,y,z

  str0 = '(%(x).0f,%(y).0f,%(z).0f) [mm]' %vars()
  DrawMarker3D('1-3DRef',x,y,z,'Red')
  DrawText3D('1-3DRef',x,y,z,str0,'red',10,'','yellow',1)

  x,y,z = GetPoint3D('Height.corner2')
  print 'pos -',x,y,z
  DrawMarker3D('1-3DRef',x,y,z,'Red')

  x,y,z = GetPoint3D('Height.corner3')
  print 'pos -',x,y,z
  DrawMarker3D('1-3DRef',x,y,z,'Red')

  w = GetValue('Height.width')
  x,y,z = GetPoint3D('Height.corner')
  x2,y2,z2 = GetPoint3D('Height.corner2')
  x,y,z = CenterPoint3D(x,y,z,x2,y2,z2)
  str0 = 'w=%(w).0f [mm]' %vars()
  DrawText3D('1-3DRef',x,y,z,str0,'red',10,'','yellow',1)

  h = GetValue('Height.height')
  x,y,z = GetPoint3D('Height.corner')
  x2,y2,z2 = GetPoint3D('Height.corner3')
  x,y,z = CenterPoint3D(x,y,z,x2,y2,z2)
  str0 = 'h=%(h).0f [mm]' %vars()
  DrawText3D('1-3DRef',x,y,z,str0,'red',10,'','yellow',1)
Example 7: Drawing a 3D Cube |
|
|
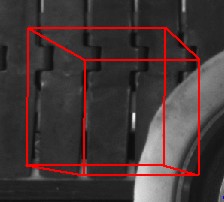
def DrawCube3D(ref,x,y,z,w,d,h,color='red',line=2):

  x1 = x + w
  y1 = y + 0
  z1 = z + 0

  x2 = x + 0
  y2 = y + d
  z2 = z + 0

  x3 = x + 0
  y3 = y + 0
  z3 = z + h

  x4 = x + w
  y4 = y + d
  z4 = z + 0

  x5 = x + w
  y5 = y + 0
  z5 = z + h

  x6 = x + 0
  y6 = y + d
  z6 = z + h

  x7 = x + w
  y7 = y + d
  z7 = z + h

  DrawLineEx3D(ref, x, y, z, x1, y1, z1, color,line)
  DrawLineEx3D(ref, x, y, z, x2, y2, z2, color,line)
  DrawLineEx3D(ref, x, y, z, x3, y3, z3, color,line)

  DrawLineEx3D(ref, x1, y1, z1, x4, y4, z4, color,line)
  DrawLineEx3D(ref, x1, y1, z1, x5, y5, z5, color,line)

  DrawLineEx3D(ref, x2, y2, z2, x6, y6, z6, color,line)
  DrawLineEx3D(ref, x2, y2, z2, x4, y4, z4, color,line)

  DrawLineEx3D(ref, x3, y3, z3, x5, y5, z5,color,line)
  DrawLineEx3D(ref, x3, y3, z3, x6, y6, z6, color,line)

  DrawLineEx3D(ref, x4, y4, z4, x7, y7, z7, color,line)

  DrawLineEx3D(ref, x5, y5, z5, x7, y7, z7, color,line)

  DrawLineEx3D(ref, x6, y6, z6, x7, y7, z7, color,line)

DrawCube3D('3dref',300,300,100,100,100,-200)
|
