|
Based on Intensity and MultiBlob,
this tool calculates statistical results for each ROI-polygon.
These values are measured for each
polygon:
- Intensity, min/max pixel value
- Contrast -measured between two
given percentile values
- Number of peaks in the
intensity histogram within the criteria; position, height, width
- Position, height and width for
the three highest peaks
- Flatness in the intensity
histogram
Conditions for OK or error for each polygon are as follows:
- Min/max intensity
- Min/max pixel value
- Min/max contrast
- Min/max number of peaks in histogram
- Min/max histogram peak width
- Min/max gradient/deviation
The result are given as a list of polygons; OK/error, AllOK, AllError.
The ROI-polygons may overlap and are handled independently.
Setup
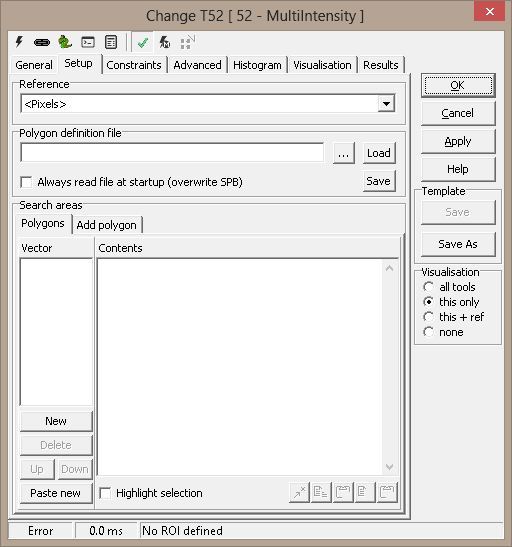
Reference - Reference system selection
Search areas - the tool's regions of interest

Constraints
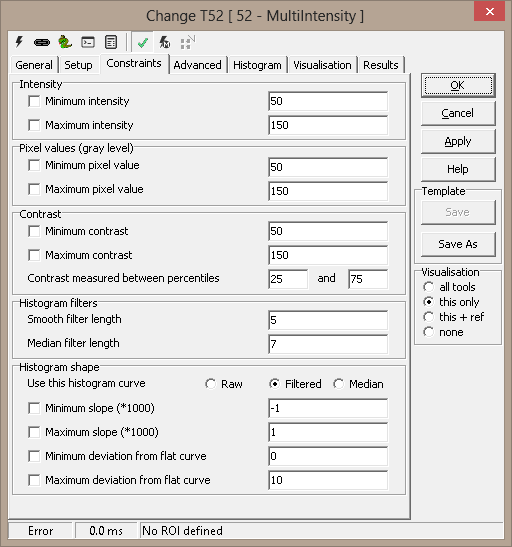
Min/Max Intensity -
Min/Max Pixel values (gray
level) -
MIn/Max Contrast
-
- Contrast measured between
percentiles -
Histogram filters
- Smooth filter length
-
- Median filter length
-
Histogram shape
- Use this histogram curve
- Raw | Filtered | Median
- Min/Max slope (*1000)
-
- Min/Max deviation from flat
curve -

Advanced
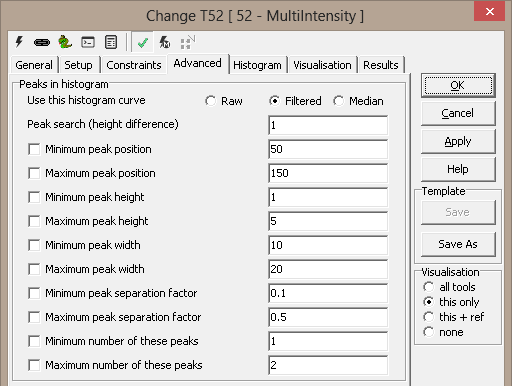
Peaks in histogram
- Use this histogram curve
- Raw | Filtered | Median
- Peak search (height
difference) -
- Min/Max peak position
-
- Min/Max peak height
-
- Min/Max peak width
-
- Min/Max peak separation
factor -
- Min/Max number of these
peaks -

Histogram
Select histogram
- ROI number - Raw | Smoothed | Median filtered
Results
|
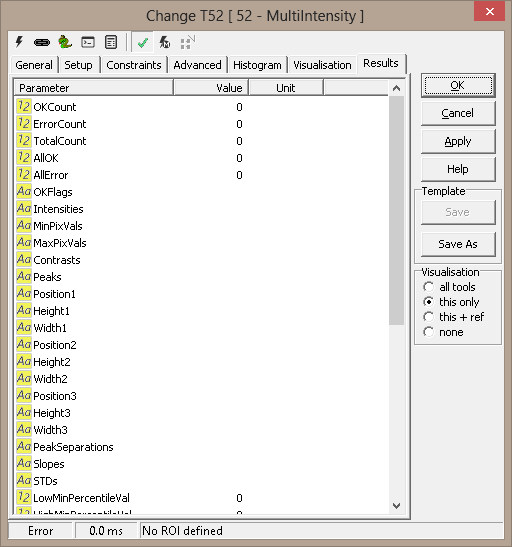
OK count
|
|
|
Error count
|
|
|
Total count
|
|
|
All OK
|
|
|
All Error
|
|
|
OK Flags
|
|
|
Intensities
|
|
|
Minimum
pixel values
|
|
|
Maximum
pixel values
|
|
|
Contrasts
|
|
|
Peaks
|
|
|
Position
1,2,3
|
Position of
the three highest peaks
|
|
Height
1,2,3
|
Height of
the three highest peaks
|
|
Width 1,2,3
|
Width of
the three highest peaks
|
|
Peak
separations
|
|
|
Slopes
|
|
|
STDs
|
|
|
Low min
percentile value
|
|
|
High min
percentile value
|
|
|
Low max
percentile value
|
|
|
High max
percentile value
|
|
|
Minimum
intensity
|
|
|
Maximum
intensity
|
|
|
Minimum
pixel value
|
|
|
Maximum
pixel value
|
|
|
Minimum
contrast
|
|
|
Maximum
contrast
|
|
|
Minimum
peaks
|
|
|
aximum
peaks
|
|
|
Minimum
slope
|
|
|
Maximum
slope
|
|
|
Minimum STD
|
|
|
Maximum STD
|
|
|
Status
|
|

Visualisation
|
Error
|
|
|
OK
|
|
|
ROI
|
Region Of
Interest for the measurement
|
ExecuteCmd support (see also executeCmd)
|
Command
|
Parameters
|
Return values
|
Comments
|
| Set |
Object=ROI;Value=<polygon> |
ok,None |
Sets
the first ROI polygon. See Copy/paste
ROIs for details. |
| Set |
Object=ROI;Number=<number>;
Value=<polygon> |
ok,None |
Sets
the numbered ROI polygon. See Copy/paste
ROIs for details. |
| Add |
Object=ROI;Value=<polygon> |
ok,None |
Adds
ROI polygon to the end of the list. See Copy/paste
ROIs for details. |
| Get |
Object=ROI;Number=<number> |
ok,<polygon> |
Gets
numbered polygon, as Scorpion polygon (StrArr format). |
| Get |
Object=Tuple;Number=<number> |
ok,<tuple> |
Gets
numbered polygon, as Python tuple |
| Clear |
Object=ROI;Number=<number> |
ok,None |
Clears
numbered polygon (makes empty) |
| DeleteAll |
- |
ok,None |
Deletes
all polygons |
Keyboard shortcuts - More
information
|
Shortcut
|
Command
|
Comments
|
| Ctrl-Z |
Set
ROI |
Sets
the selected polygon to points marked in the image. If only a single
point is marked, the polygon is moved, centered around the point.
If the tool dialog is not open, the first polygon is set. |
| Ctrl-1
- Ctrl-0 |
Set
polygon 0-10 |
Sets
the numbered polygon to points marked in the image. If only a single
point is marked, the polygon is moved, centered around the point. If
a new polygon is defined this way, any missing polygons in between
are set as empty. |
| Ctrl-Shift-1
- Ctrl-Shift-0 |
Clear
polygon 0-10 |
Clears
the numbered polygon (sets empty). |
| Ctrl-Shift-A |
Add
polygon |
This
is a shortcut to the 'Add polygon' button on the "Setup/Add
polygon" page, and is only effective when that page is visible. |
|