|
The ColorAnalyzer
can identify connected colored areas in an image. It is based on the
ColorMatcher
tool, and uses the same algorithm for color matching; defining colors and a
set of reference images to each color is also done the same way. The image
is divided into a regular set of rectangles, and a match is performed on
each rectangle. The results are then grouped by a blob analysis.
You can also add
inactive colors to the tool, e.g. backgrounds. The inactive colors
will be matched, but not reported or grouped.
Test Profile The
following testprofile are available for the ColorAnalyzer:
Setup
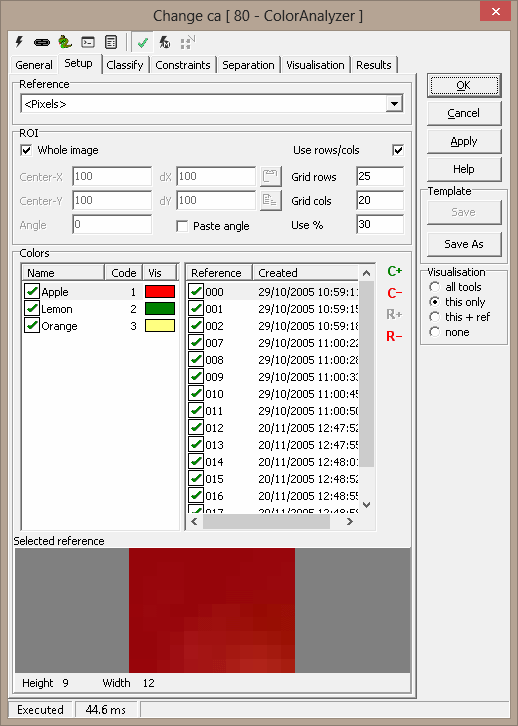
Reference - Reference system selection
ROI - the tool's region of interest
- Whole picture - the whole picture is analysed instead of the
selected rectangle
- Use rows/cols - active
- specify the number of columns and rows in the grid inside the ROI -
with Grid Rows and Grid Cols
- Use rows/cols - deactivated
- Grid-X, Grid-Y - the pixel size of the cells for color analysis
- Center-X, Center-Y, dX, dY - ROI rectangle
- Angle - the angle of the ROI rectangle
- Use% - percentage of pixels within grid rectangles to use
(centered within rectangle)
- Decreasing this number will decrease the image processing time
The ROI can be managed by the buttons

- Paste - paste the ROI from the image to the scorpion clipboard
- Copy - copy the ROI to the image from the scorpion clipboard
Point & Click Clipboard Support
 The rectangular
ROI
is defined by four points.
The rectangular
ROI
is defined by four points.

One point will change the center point.
Resample grid
See static grid.
Colors
- Selected Reference - displays the image of the selected
reference
 - Adds a color with a given name - Adds a color with a given name - Removes a color with it's
reference images - Removes a color with it's
reference images - Adds the current image as a
reference to the selected reference - Adds the current image as a
reference to the selected reference - Removes the selected reference - Removes the selected reference
Colors Mouse Menu
-
Add color
-
Active - toggle the active flag (inactive colors are not
reported as results, and are listed with yellow checkmark in front of
the name)
-
Set code - a colors numeric value
-
Set display color - for visualisation
-
Rename color
-
Delete color
-
Delete all references
Reference Mouse Menu
-
Add reference
-
Rename reference
-
Delete reference
-
Delete all references
Adding references using Point & Click

By adding a rectangle to the clipboard selecting the a named
color and pressing  will add a reference image to the tool.
Classify
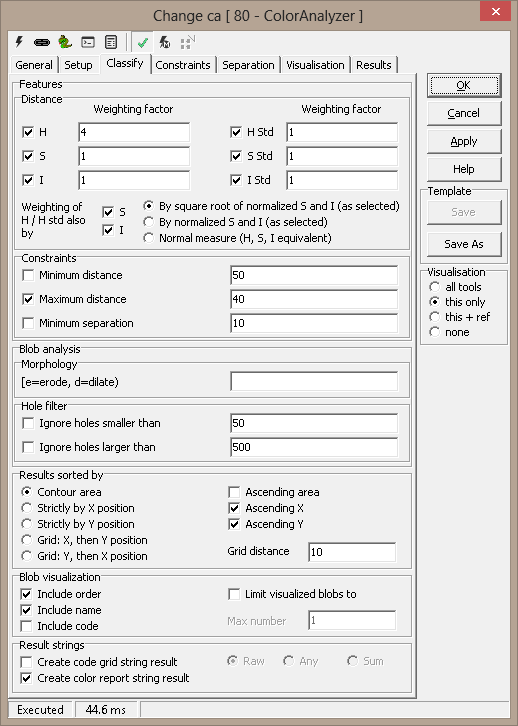 Feature distance
Note: adding the standard deviation coeffisient to the distance
measure makes it possible to separate non-monochrome colors.
Constraints
-
Maximum distance - the maximum distance to the current image for a reference image to be accepted
-
Minimum Separation -
the minimum separation between the
best and the second best color for the color to be accepted
Note: The separation is often used to get only clear
colors matched - A typical value can be 6.
Blob analysis
A blob analysis is performed on the classified
rectangles, creating connected color areas. The blobs can be grown and
shrunk using a Morphology string.
Hole filter
Blob holes can be ignored based on size.
Results sorted by A number of
"the best" blobs are reported in the Results pane; here you
decide which blobs are considered "best". Result
string
Constraints
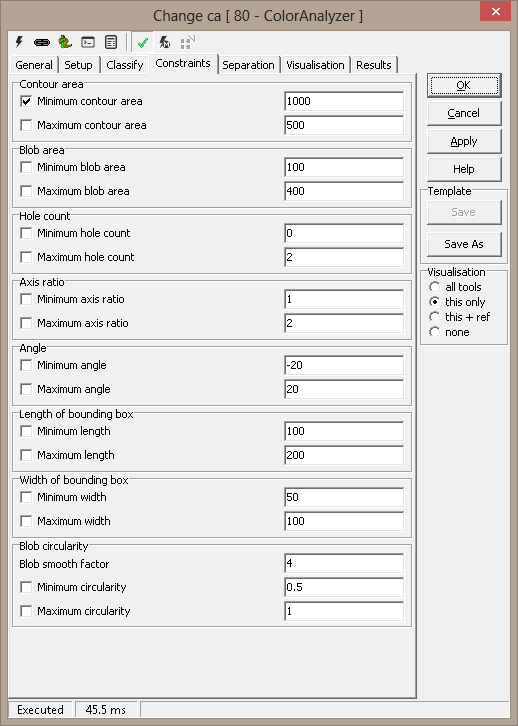
The blobs resulting from the analysis can be filtered out by a set of
criteria:
-
Contour area - the total area of the blob
-
Blob area - contour area minus area of any holes
-
Hole count - number of holes in the blob
-
Axis ratio - length/width of bounding box
-
Angle - angle of bounding box major axis
-
Length of bounding box
-
Width of bounding box
The bounding box is the smallest possible rectangle
containing the blob.
Separation
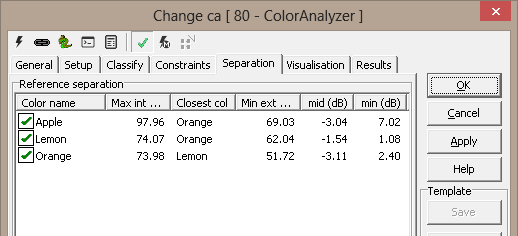 This
is a list of statistics for the defined colors. Within each color group the least
similar sample is found, and its mean distance to the other references
in the same group is calculated (Max int dist). Further, this reference's
mean distance to each of the other color groups is found, and the nearest
result is reported (Closest col and Min ext dist). The
ratio between Min ext. dist and Max int. dist in dB is
reported as mid. A negative value here means the reference is on
average closer to another group than its own. Finally,
the ratio between the least similar sample's closest match to any
reference in other color groups and the closest match within its own
group is reported, also in dB. Even if the mid value is low, this min
value can be positive, which means the reference is still closer to its own
group, though not on average. These
results can be used to spot outliers in a color group. If the mid separation in
dB falls below the Mid color separation warning threshold, and the min
separation below the Closest separation warning threshold, the
checkmark in front of the color name turns red. You can spot the outlier
reference under the Setup page as well, where both the color and the
reference will be marked in red. NOTE: this has NO
effect on the tool's results, it is just an aid in setting up well defined
color sets.
Visualisation
|
BoundingBox
|
She smallest rectangle containing the blob. See note
|
|
ColorName
|
Color name. See note
|
|
Grid
|
Analysis rectangles
|
|
Match
|
Found color areas. See note
|
|
ROI
|
Region of interest
|
Note: The visualisation colors for the BoundingBox,
ColorName or Match are not used. Instead, individual colors can be defined under the Setup
tab.
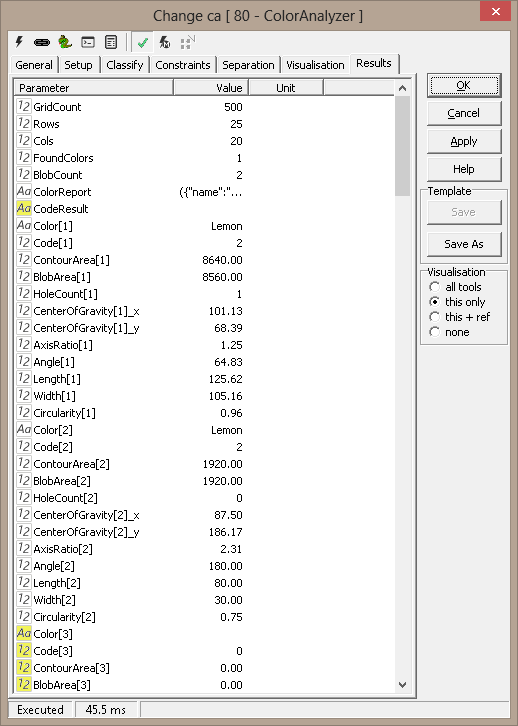
Results
|
Number of grid rectangles |
Total number of analysis rectangles |
|
Found
colors
|
Number of
unique colors identified in the image
|
|
Blob count
|
Total number of color blobs
|
|
Color report |
A Python dictionary detailing the results. For each color set the
name, the number of blobs found and the color coverage (in percent) is
given. See also examples. |
|
Color[1-8] |
Color name, first 8 sorted blobs |
|
Contour area[1-8] |
Contour area, first 8 sorted blobs |
|
Blob area[1-8] |
Blob area, first 8 sorted blobs |
|
Hole count[1-8] |
Hole count, first 8 sorted blobs |
|
Axis ratio[1-8] |
Bounding box axis ratio, first 8 sorted blobs |
|
Angle[1-8] |
Bounding box angle, first 8 sorted blobs |
|
Length[1-8] |
Bounding box length, first 8 sorted blobs |
|
Width[1-8] |
Bounding box width, first 8 sorted blobs |
|
Grid code result |
result string |
ExecuteCmd support (see also executeCmd)
|
Command
|
Parameters
|
Return values
|
Comments
|
|
Set |
Object=ROI;Value=<polygon>
Object=ROI;Value=cx,cy,dx,dy |
ok,res
ok,res |
Sets the tool's ROI. See Copy/paste
ROIs for details. |
|
Get |
Object=ROI |
ok,<polygon> |
Current ROI as rectangular, closed polygon |
| Set |
Object=Reference;Color=<color>;
[Name=<name>;][Code=<code>;]
Value=<polygon>
|
ok,None
|
Creates
or replaces named color reference. The polygon defines the reference's
position in the image. Name and Code are optional |
| Get |
Object=Colornames |
ok,<names> |
All
color names as a Python tuple |
| Get |
Object=Referencenames;Color=<color> |
ok,<names> |
All
reference names defined for the named color |
| Delete |
Object=Color;Name=<name> |
ok,None |
Removes
named color and all its references |
| Delete |
Object=Reference;Color=<color>;
Name=<name> |
ok,None |
Deletes
specified color reference |
| DeleteAll |
Object=Color;Color=<color>; |
ok,None |
Deletes specified color references |
| DeleteAll |
- |
ok,None |
Deletes
all colors and references |
Example - Color Report:
r=eval(GetValue('CA.ColorReport'))
for x in r:
print x
This will print a report to the console:
{'count': 1, 'name': 'Black', 'coverage': 5.7800000000000002}
{'count': 1, 'name': 'Blue', 'coverage': 5.0300000000000002}
{'count': 11, 'name': 'Brown', 'coverage': 6.46}
{'count': 1, 'name': 'Red', 'coverage': 6.6799999999999997}
{'count': 1, 'name': 'Yellow', 'coverage': 2.9300000000000002}
Example - Grid code result:
matrix = (eval(GetValue('ca.Grid code result')))
print len(matrix)
print len(matrix[0])
for x in matrix:
print x
This will print a report to the console:
10
10
(0, 0, 0, 0, 0, 4, 4, 4, 0, 0)
(0, 0, 0, 0, 0, 4, 4, 4, 0, 0)
(0, 0, 0, 0, 0, 4, 4, 4, 0, 0)
(0, 0, 0, 0, 0, 4, 4, 0, 0, 0)
(0, 0, 0, 0, 4, 4, 4, 0, 0, 0)
(0, 0, 0, 0, 4, 4, 4, 0, 0, 0)
(2, 0, 0, 0, 4, 4, 0, 0, 0, 0)
(2, 0, 0, 4, 4, 4, 0, 0, 0, 0)
(2, 0, 0, 4, 4, 4, 0, 0, 0, 0)
(2, 0, 4, 4, 4, 0, 0, 0, 0, 0)
# we see that two colors are present in the region
|
